
If you're paying attention to the financial sustainability of independent schools, you cannot ignore what is happening with public money and private schools right now. What's happening is big, and I wanted to look at it from a data perspective, not just from the headlines. So over the past several weeks I have been doing my own research on the topic.
One note on scope up front. Everything I looked at here is about independent schools specifically — a subset I define below and refer to as independent-type schools. It is not a study of private schools generally, and that distinction matters for how the numbers read.
As of this month, roughly eighteen states have enacted education savings account (ESA) or voucher programs open to essentially every family, regardless of income. Florida's choice population across its programs sits near half a million students and has roughly doubled in three years. Texas launched this year, funded about 101,600 students, and left more than 100,000 on a waitlist. A reasonable estimate puts the national figure above 1.3 million funded students, though the true number is hard to pin down: nobody publishes a clean national count, and definitions differ by state.
And a federal layer arrives next. A new federal scholarship tax credit takes effect January 1, 2027, with no aggregate national cap and a state-by-state opt-in. Its regulations aren't final yet, so the details that matter most to schools are still up in the air.
This article is not meant to be a public position on school choice. Rather, it is a recognition that these programs carry impactful and relevant data for schools. It is a complex and often confusing topic, with a lot of nuance, and what I want to do is bring numbers into the discussion.
One thing I hear frequently in conversations with independent schools is that, to protect a school's independence, we are reluctant — or at least cautious — about taking government money. It is a statement about identity as much as about finance, and it does real work in board discussions.
It is also checkable.
So I split the research in two:
Use data to understand the actual history of independent school participation in PPP.
Look at what the state voucher program data tells us so far.
This article is the first part.
The one time this was actually tested
In the spring of 2020, the federal government offered private schools a large amount of money on a short deadline, and then published a record of who took it. That is the only occasion I know of where the sector's position on government money was tested at scale, with the results in public.
I was consulting at the National Association of Independent Schools (NAIS) at the time, and I had a close view of how schools talked about it. What I remember is real concern about independence — that federal money would impose federal conditions, and that those conditions would extend into areas independent schools consider theirs to decide.
One aside, since I went looking for it. I did not find a long period of deliberation in the data; schools moved quickly. I don't read that as evidence that the discussions I remember didn't happen. Round one of PPP was $349 billion, first-come, first-served, and it was gone in 13 days. Everyone was moving quickly, and an approval date tells you when a school got through the queue, not when it made up its mind.
What I looked at
Everything below describes a subset of 944 schools that I identified as independent schools — the ones this audience would recognize as peers. This includes independent day and boarding schools, and — despite a faith-based categorization they might otherwise fall under — Friends, Episcopal, and Jewish schools. Parochial-model schools are excluded, both because they operate differently and because their financial data is not in the public sources I am using.
One note on my classification of "independent." There is no official register of independent schools, so the set here is my own construction, built by filtering public data. It is not a membership list, and specifically it is not NAIS's — I have no access to that roster. It is incomplete by construction but, I feel, large and diverse enough to draw data-driven conclusions.
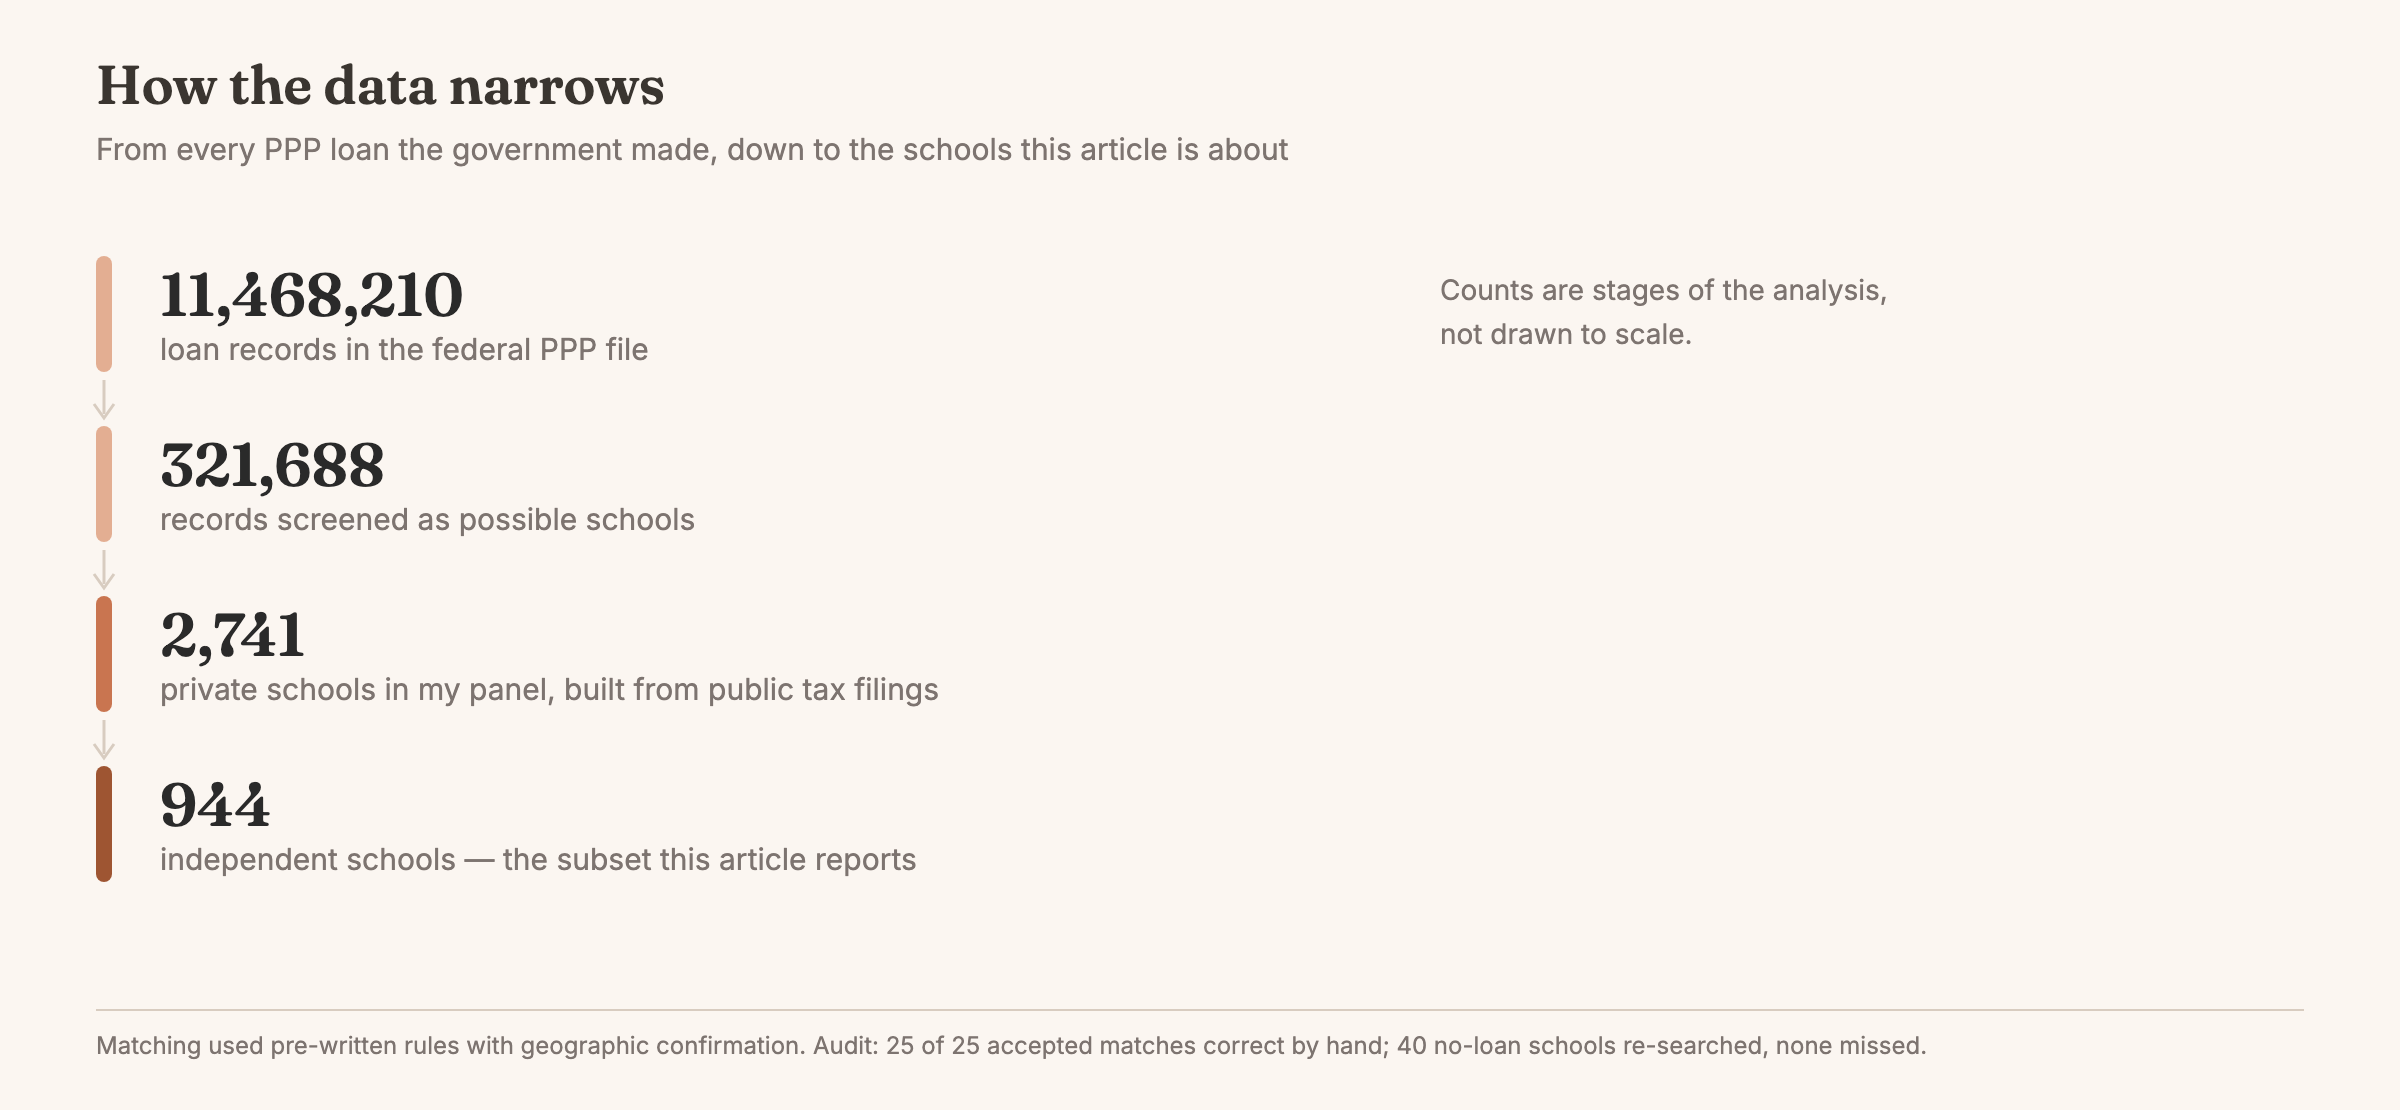
That subset sits inside a larger database I had already assembled — a panel of roughly 2,700 schools, most with their operating size and balance-sheet position attached. The SBA's public PPP release holds about 11.5 million loan records.
The real work is joining the two. I wrote the matching rules and hand-reviewed every ambiguous pair rather than letting a similarity score decide. Then I ran audits on my own work. I re-checked 25 accepted matches by hand; all 25 were right. I went back through 40 schools recorded as taking no loan, looking for one I'd missed; there weren't any. I also ran the whole analysis three separate times, under three different definitions of which schools count as independent. Every rate moved by about three points. None of it changed the picture.
What the schools did
The caution is real — I heard it at the time, and I hear it now. What the record shows is that it did not keep schools out.
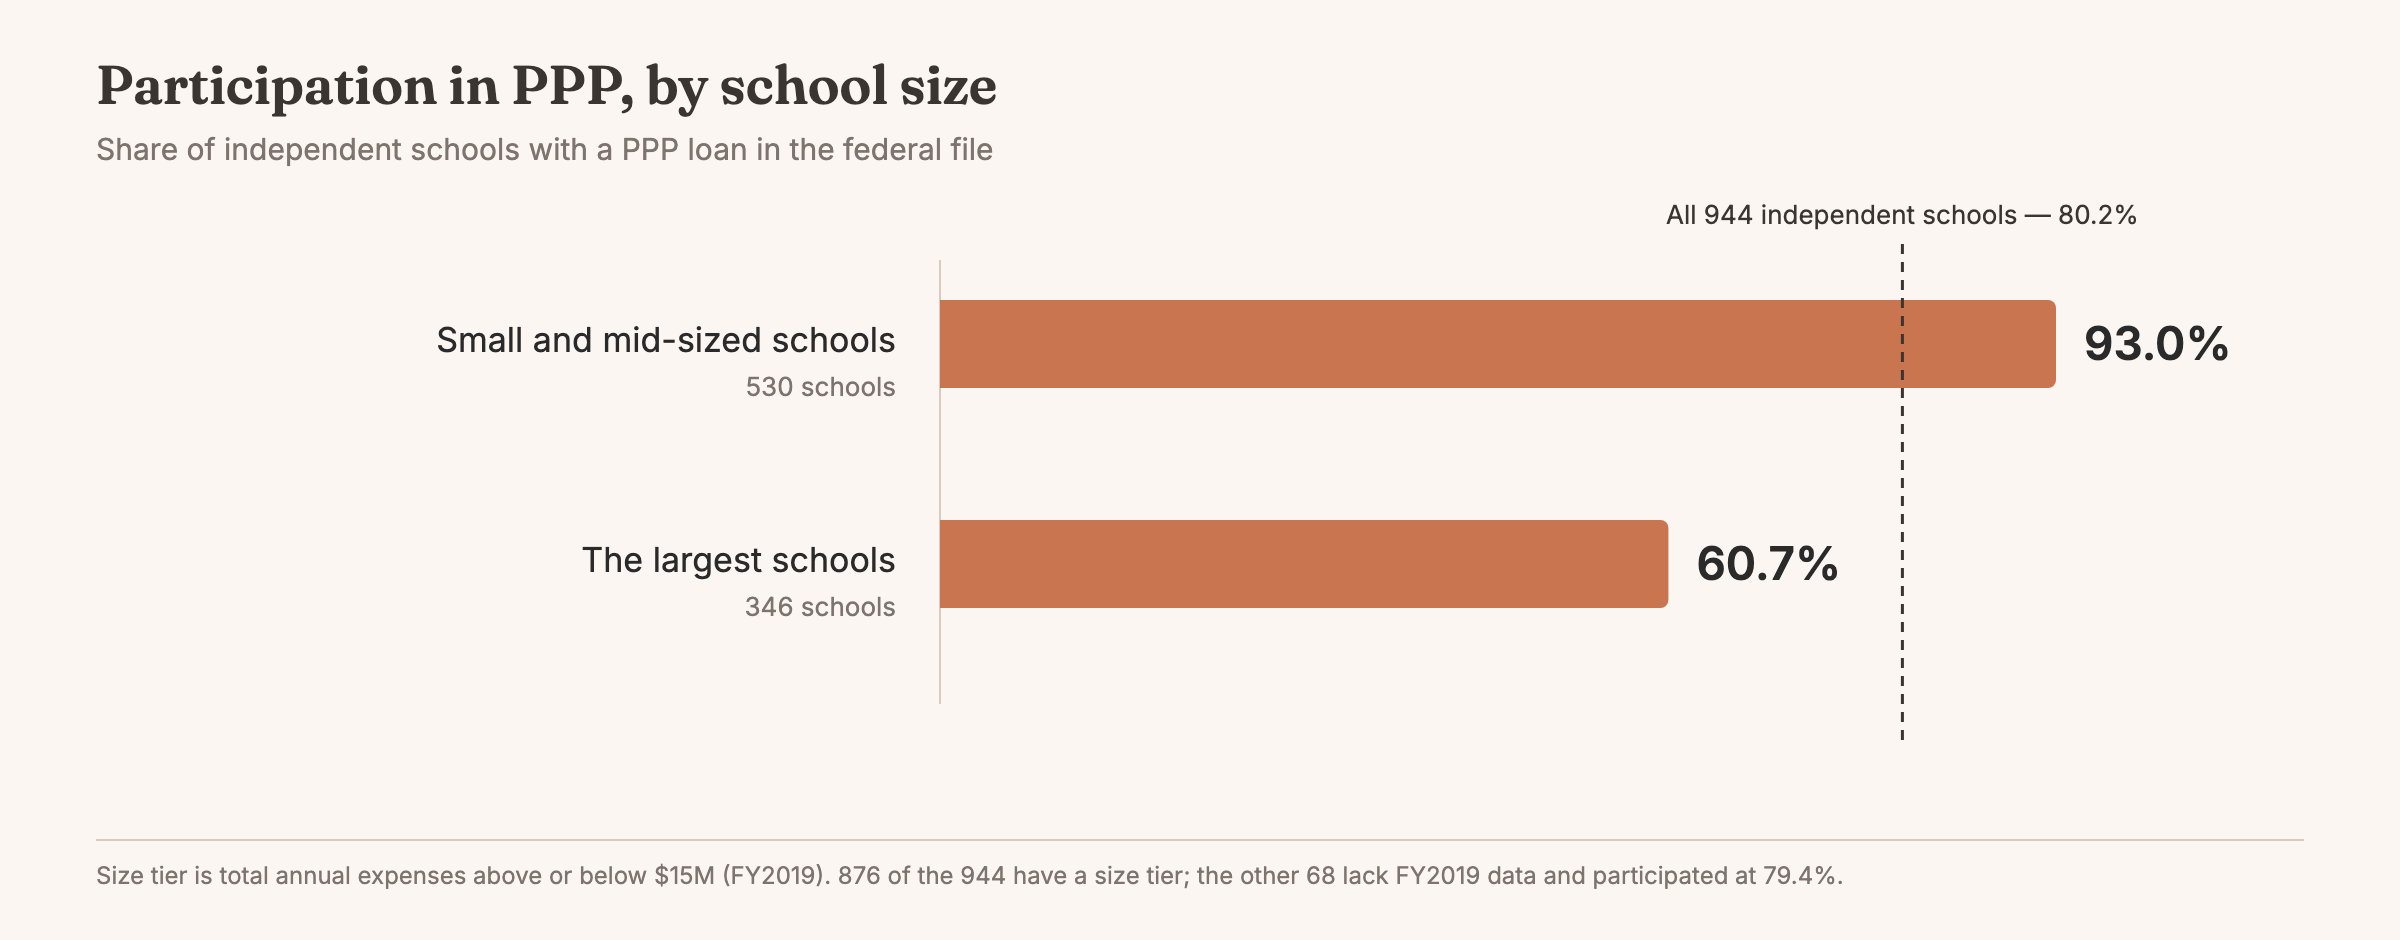
About 80% of those 944 schools have a PPP loan in the federal file. Among small and mid-sized schools — the financial middle, the schools I most wanted to understand — it is 93%.
Ninety-three percent is not a decision pattern. That is essentially a default.
I want to be careful about what that does and doesn't imply. It means that when a large sum arrived on a short deadline in a genuine emergency, nearly all of them participated. Every school in this data was making a defensible decision, quickly, under real uncertainty, with payroll on the line.
The exception at the top
Among the largest schools — those above $15 million in annual expenses — participation runs about 61%.
But size is not what separates them. Split those same large schools by their balance sheets, measuring net assets against a year of operating expenses, and the picture changes completely. Large schools with a thinner cushion participated at 89.3%, essentially the same rate as the rest of the sector. Large schools with the deepest cushion participated at 48.6%.
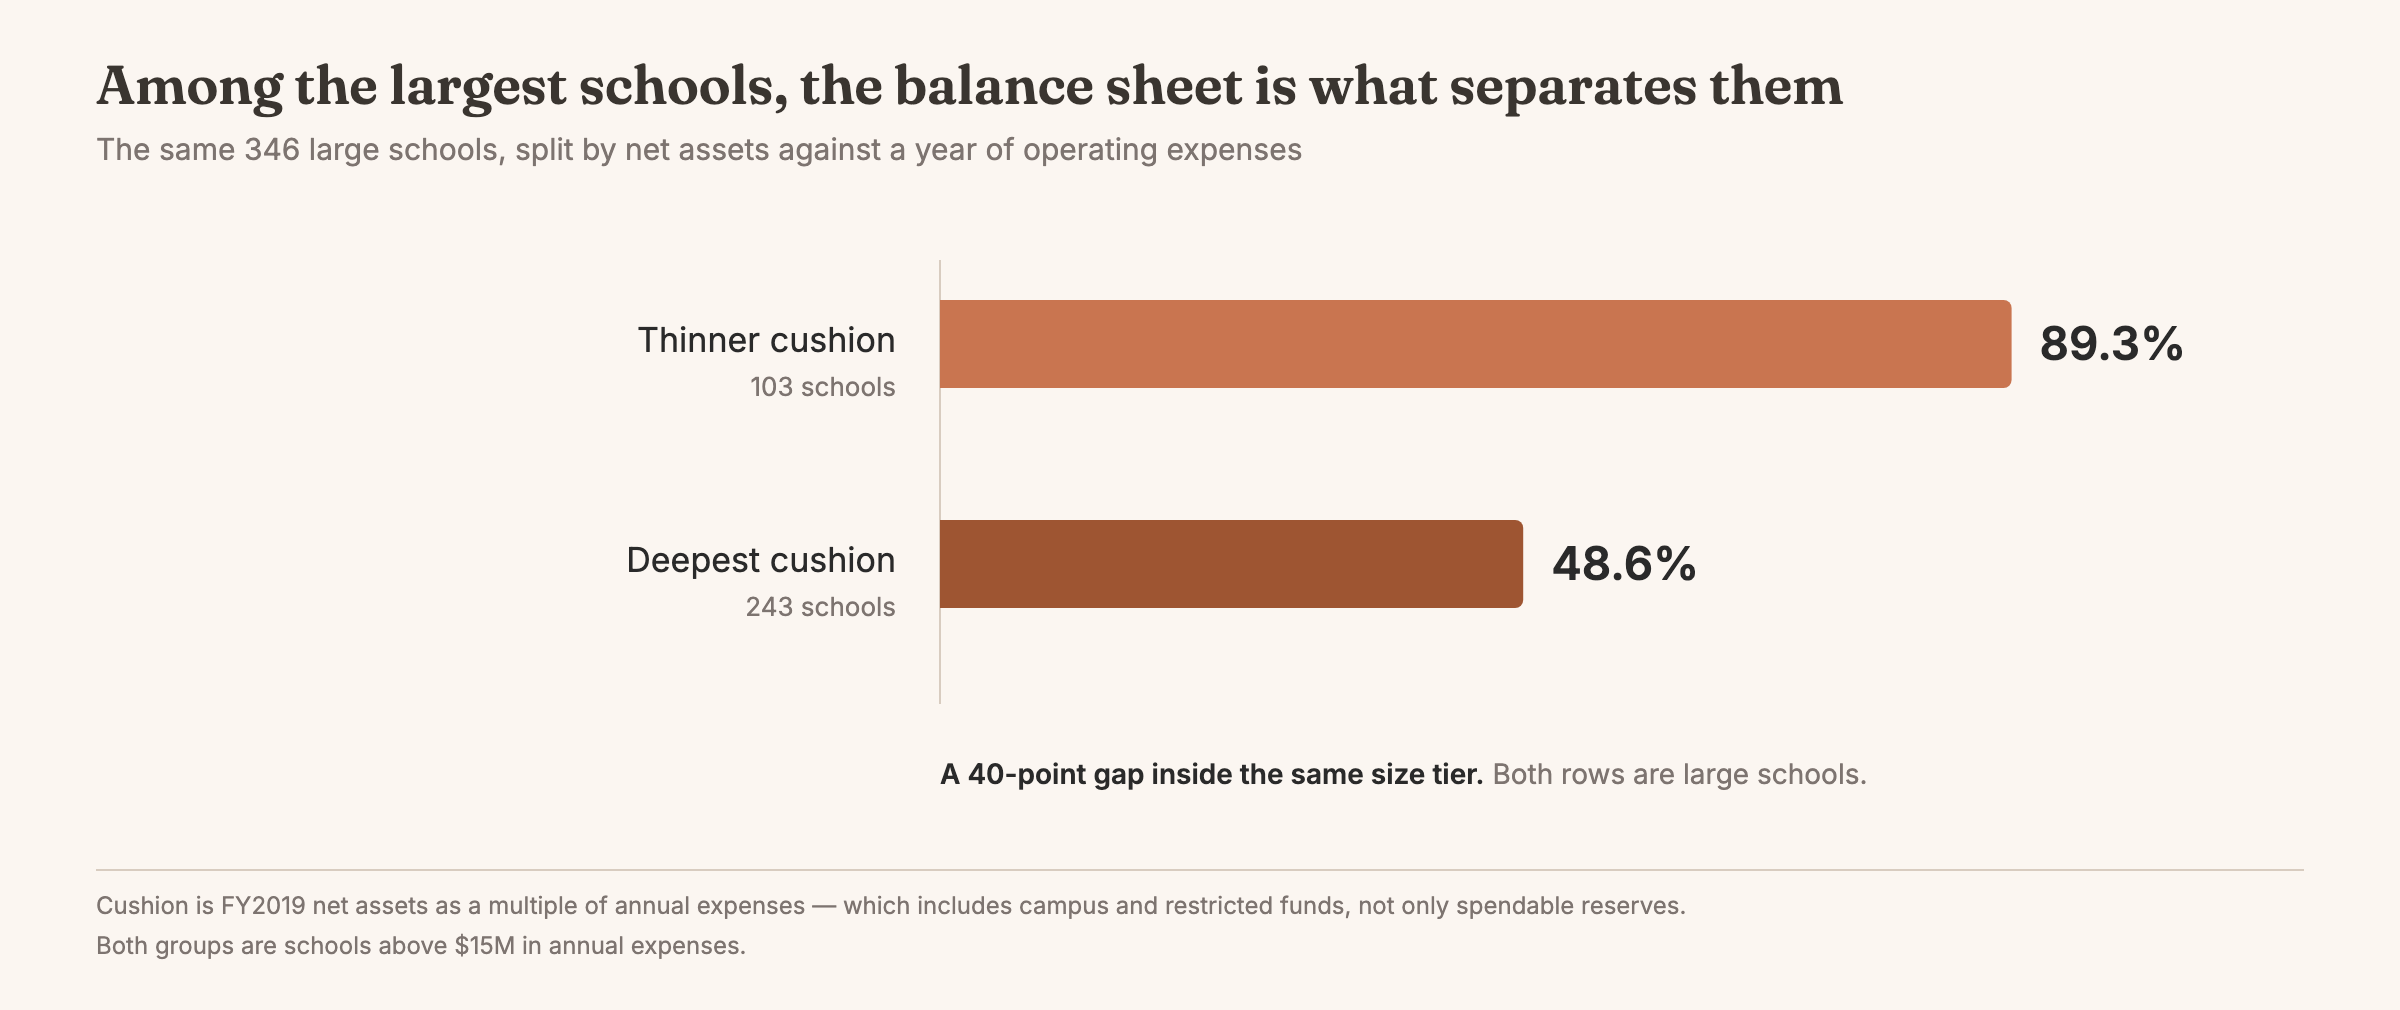
That is a forty-point gap inside a single size tier. Every school in both groups is large and well established. What differs is the balance sheet.
One disclosure that moves these numbers. PPP's first draw generally required 500 or fewer employees, and 53 schools in my set report more than that on their tax returns — all of them in the largest tier. That measure is not PPP's test, though. A tax return counts W-2 recipients across the year, including part-time and seasonal staff, and fifteen schools above the same threshold do have loans. Treat it as a signal, not a bar. Setting those 53 aside anyway, the large-school rate rises from 60.7% to 66.6% and the deepest-cushion rate from 48.6% to 54.7%, narrowing the gap from about 41 points to about 38. The pattern holds under either treatment, so I am showing both.
What the record cannot tell you
136 of the largest schools have no PPP loan in the federal file, and it is tempting to call those 136 schools that declined. The record does not support it. Thirty-eight reported more than 500 W-2 recipients, so they may have run into a headcount constraint rather than made a decision. One is a school I can document as having taken a loan and given it back, so the file no longer shows it. For the remaining 97, the record simply does not say.
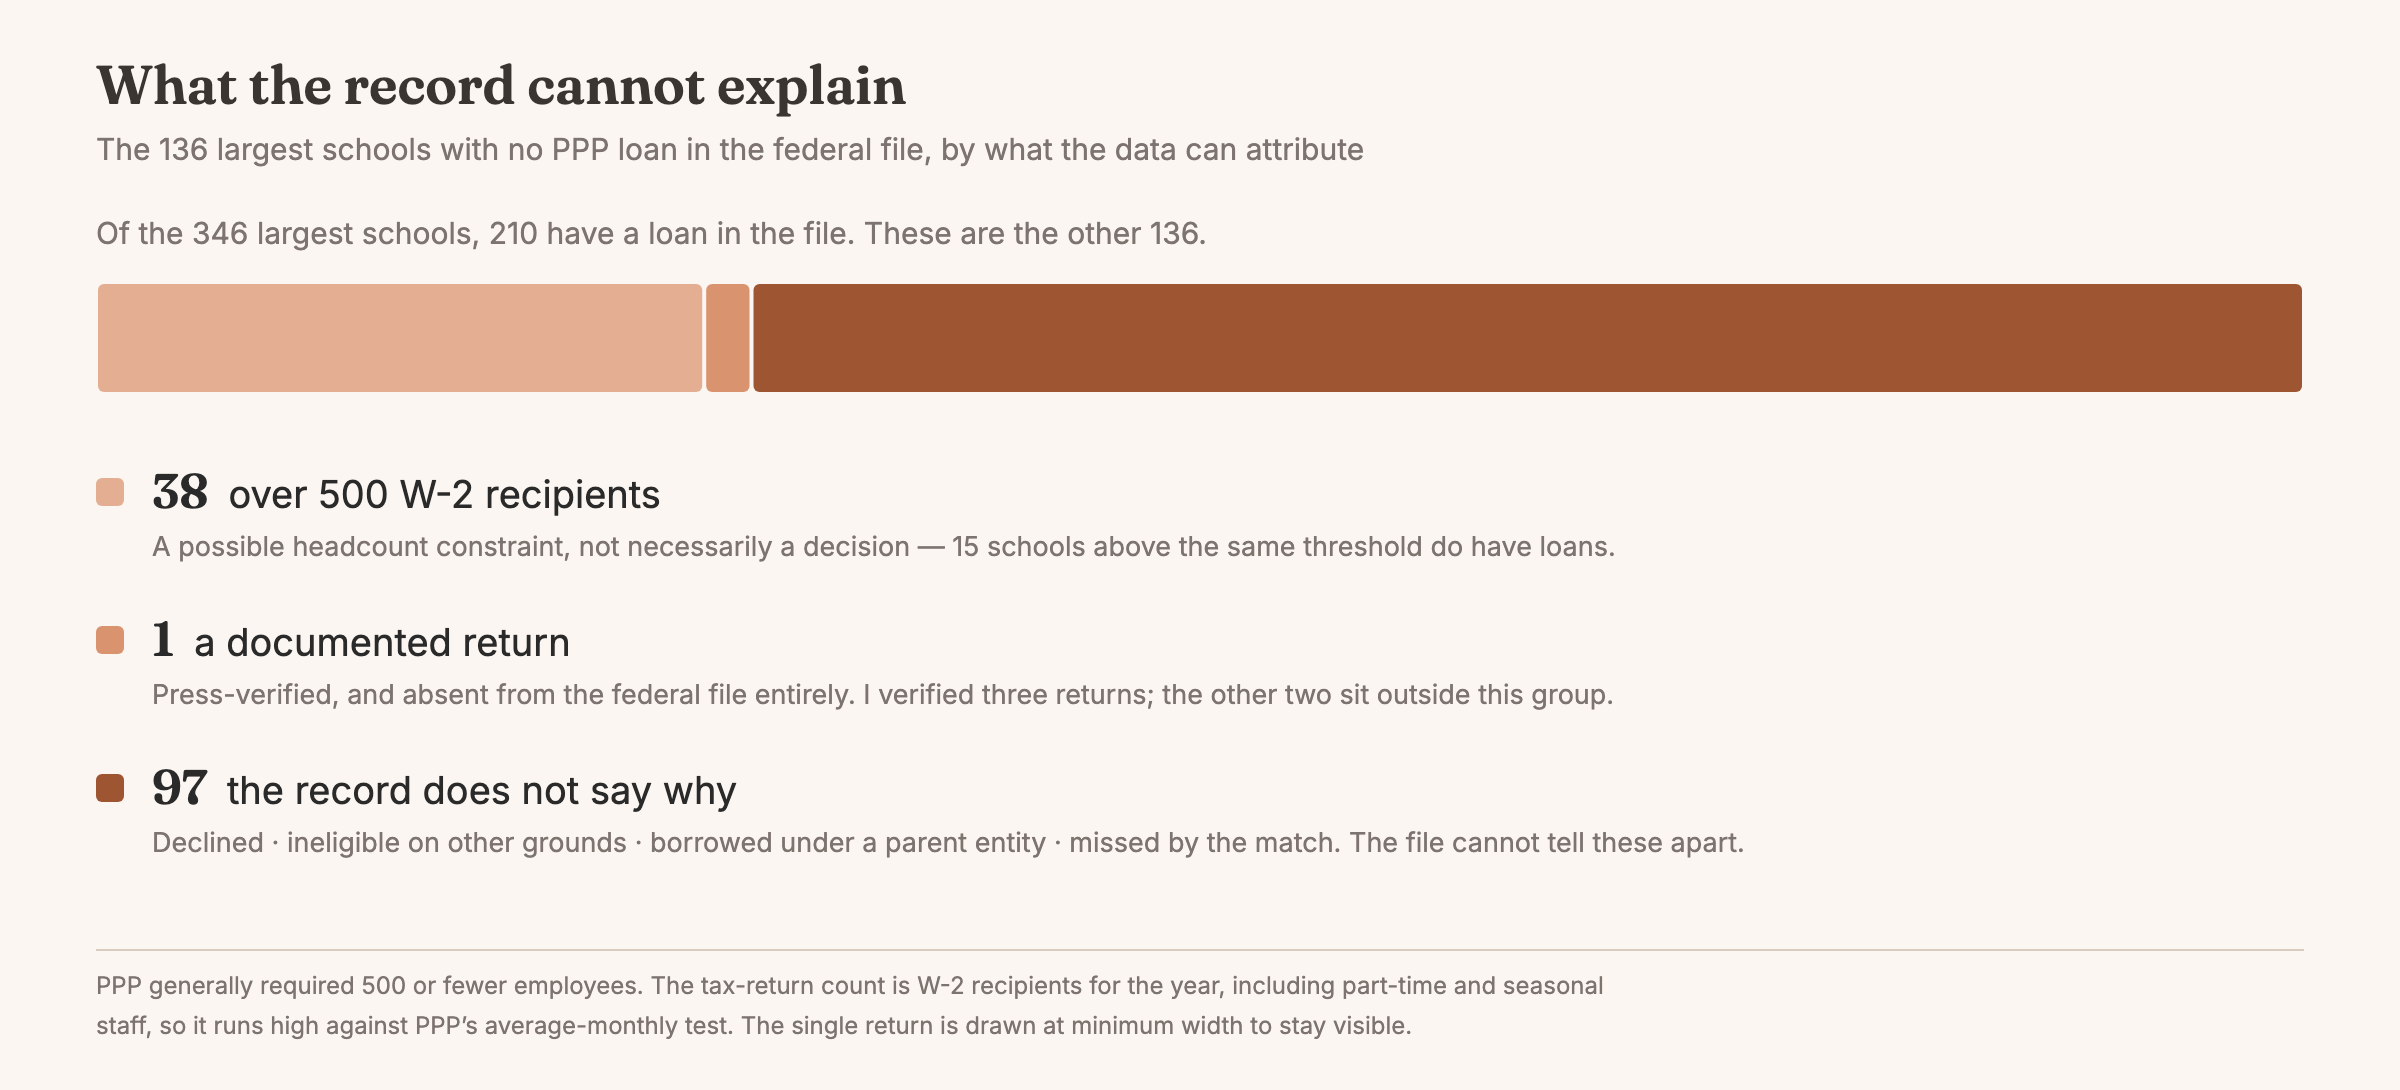
The public record can tell you who participated. It cannot tell you who refused. A refusal leaves no trace, and neither does giving the money back — I verified three schools that returned their loans under public pressure, and two of them are absent from the file entirely.
So any clean-looking count of schools that said no to PPP is measuring something else.
What carries forward to the voucher question
I want to be careful about how far this comparison carries, because these are not the same decision. PPP was a time-limited emergency loan during a forced closure, and for most schools, once it was forgiven, the relationship with the government ended. A state program is recurring. Depending on the state, it can carry testing and reporting requirements that continue for as long as a school participates, and once families are enrolled in those funds, a school that wants out has a harder time unwinding than a school that repaid a loan in 2020. I don't think the 2020 pattern simply transfers, and I'm not going to argue that it does.
Two things still seem worth carrying into the state data.
The first is that the premise does not hold. Whatever independent schools say about government money, the one time it was tested at scale, nine in ten schools in the financial middle participated. That is worth knowing before anyone builds a plan on the assumption that peer schools will stay out.
The second is that balance-sheet position — not size — is what separated behavior at the top of the market. If that association holds for state programs, then part of the participation question is answerable in advance, from public filings.
Only part of it. How participation aligns with a school's mission is the discussion occurring in schools, and it is the thing this data cannot see. A tax return records what a school has and even includes the school's mission statement. What it cannot record is whether a program would sit badly with that mission, or what a board says to itself when the two pull in opposite directions.
I can tell you which schools could afford to say no. I can't tell you which ones will.
One last thing the 2020 record is worth remembering for. PPP was not condition-free. It carried statutory conditions from the first day — how the money could be spent, what had to be certified, what forgiveness required. What arrived later, and what people actually remember, was the reputational price, once public attention turned to well-resourced schools that had taken it. State ESA and voucher conditions are different in an important way: many of them are recurring program requirements a board can read and weigh before participating, rather than a judgment that arrives afterward.
Part 2 looks at what the state programs have actually produced so far.
