
What Happened in the States That Have Vouchers
Part 1 of this research looked back at what independent schools did in 2020, when federal money became available on a tight deadline. This part looks at what is happening now, in the states already running voucher and education savings account programs.
For most independent schools, the decision to take this money starts with mission. The conversation among school administrators and boards weighs a program's rules against the potential revenue.
But I wanted to see if I could get a sense of what decisions independent schools are currently making about these state programs. I set out to look across states, and I want to be honest about why this article is narrower than that.
Two things make this harder than it looks
The first is that these programs are not one thing. States have built them through at least four different mechanisms — vouchers, tax-credit scholarships, education savings accounts, and refundable tax credits — and each carries different rules about who qualifies, what the money can buy, and what a participating school takes on. Award sizes vary widely from state to state. Some programs are open entitlements; others are capped, with waiting lists and lotteries. Several are in active litigation. A finding from one state frequently does not travel to the next, because the thing being measured is not the same thing.
The second obstacle, unfortunately, is that for most states the public record is too thin to analyze.
I came to treat that as a finding in its own right. When I studied Florida, the largest result was a negative one — the state's Department of Education publishes no per-school scholarship counts for any program, in any year, going back to 2005. Two of the questions I had registered in advance simply could not be answered, because the data to answer them does not exist. Texas publishes no state-maintained list of participating schools and no school-level information about money received or spent. Ohio masks any count below ten and publishes its figures inside interactive dashboards rather than as a spreadsheet. Wyoming publishes no participation data at all. Pennsylvania's most recent figures are from 2022–23.
North Carolina is the exception. It posts a per-school spreadsheet every year, and has done so long enough to build a record. That single fact is the reason a four-year series exists anywhere in this research.
So this article draws on two states.
North Carolina, because it has both the best public data and the longest history.
Texas, because it launched this year with the largest standard award in the country, and a first year is where you see arithmetic that maturity later hides.
North Carolina: four years, one line
A word first on what I am counting. My group is 92 schools, built from federal survey data using the same definition I used in Part 1: schools classified as nonsectarian, plus the Episcopal, Friends and Jewish schools this audience would consider independent-type. Parochial-model schools and special-emphasis programs are excluded. That is a reasonable public-data stand-in for what most people mean by an independent school, not a membership roster.
Across those 92 schools, participation in North Carolina's Opportunity Scholarship over four consecutive years ran 55.4%, then 56.5%, then 53.3%, then 57.6%. Underneath that line the record is simpler than a percentage suggests. About half of these schools took the money in every one of the four years. A third never took it in any year. One school in seven moved, in or out or both.
Those four years straddle a major expansion of the program. Between the second and third of those years, North Carolina removed its income cap and opened eligibility to essentially every family. Statewide, annual funding went from about $186 million to about $432 million, and participating schools rose from 592 to 642.
The program more than doubled, and participation among these independent-type schools did not rise with it. The tempting reading, that the money failed to persuade anyone, asserts more than a participation count can carry.
Who is in, and who is out
The flat line is two very different groups holding still.
Sorted by size, participation is a barbell. Among schools with 50 to 400 students, 84% are in. Among the very smallest, under 50 students, which are mostly small early-childhood and micro-school operations the federal survey sweeps in, one in five is in. Among schools with 400 or more students, half are in, and of the eleven I can identify with budgets above $15 million, three.
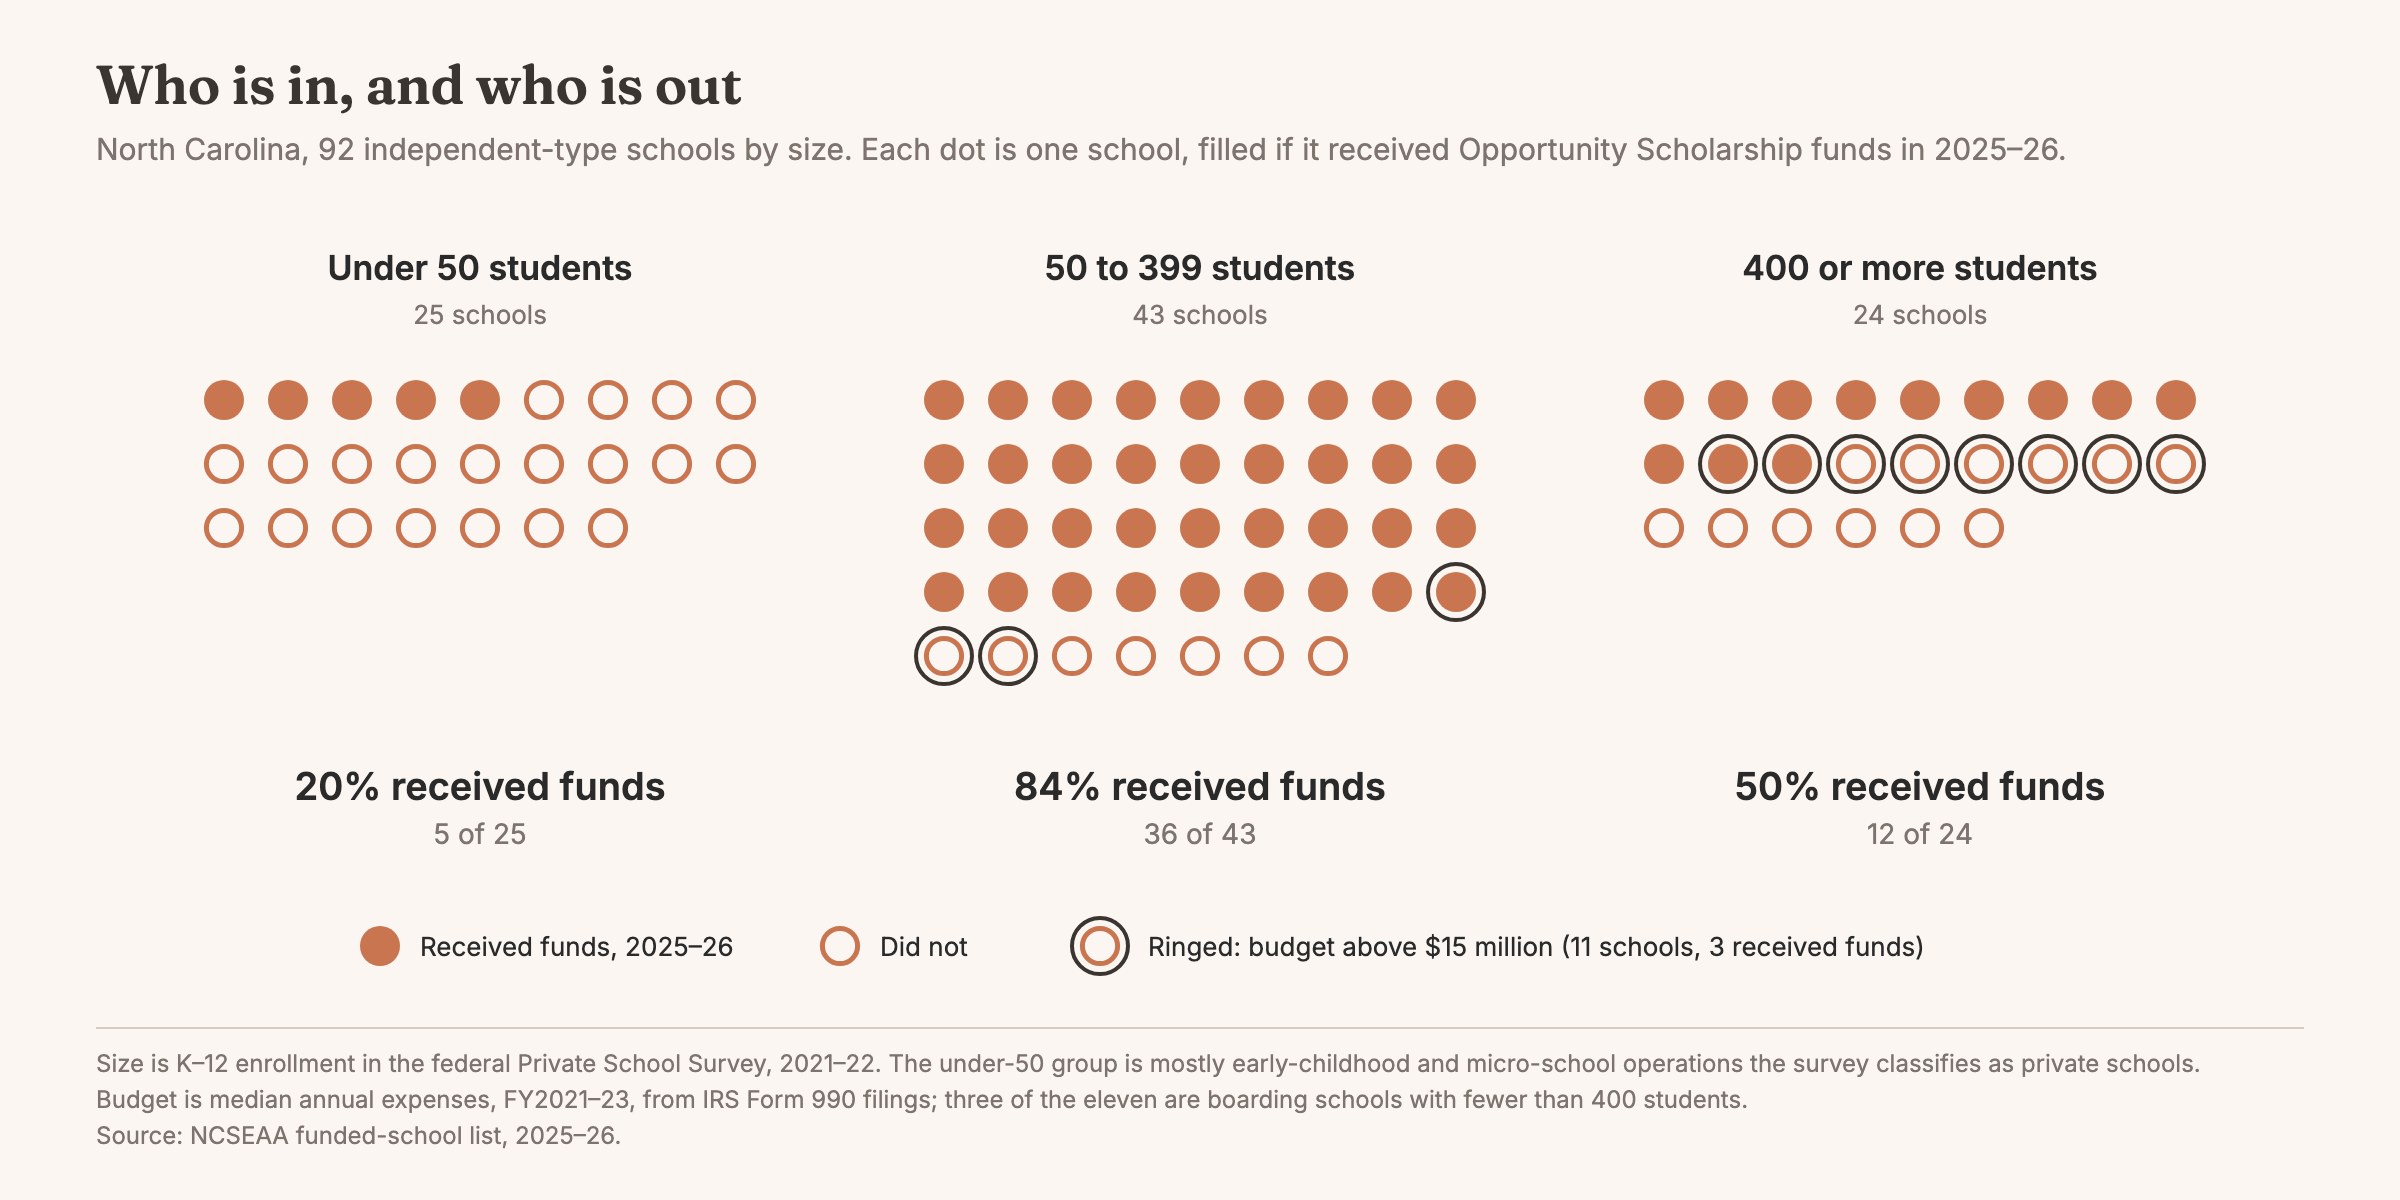
Of the 33 schools that never participated, eighteen have fewer than 50 students and eight are among the eleven schools with budgets above $15 million.
The movement that did happen ran both ways, at every size. Three mid-sized day schools left and stayed out. One of the state's largest schools joined in the expansion year, and another, a boarding school, joined the year after. Two schools left and came back, one of them publicly, after sitting out the year it said it would. Joining is not a decision made once.
How much of the bill the award covers
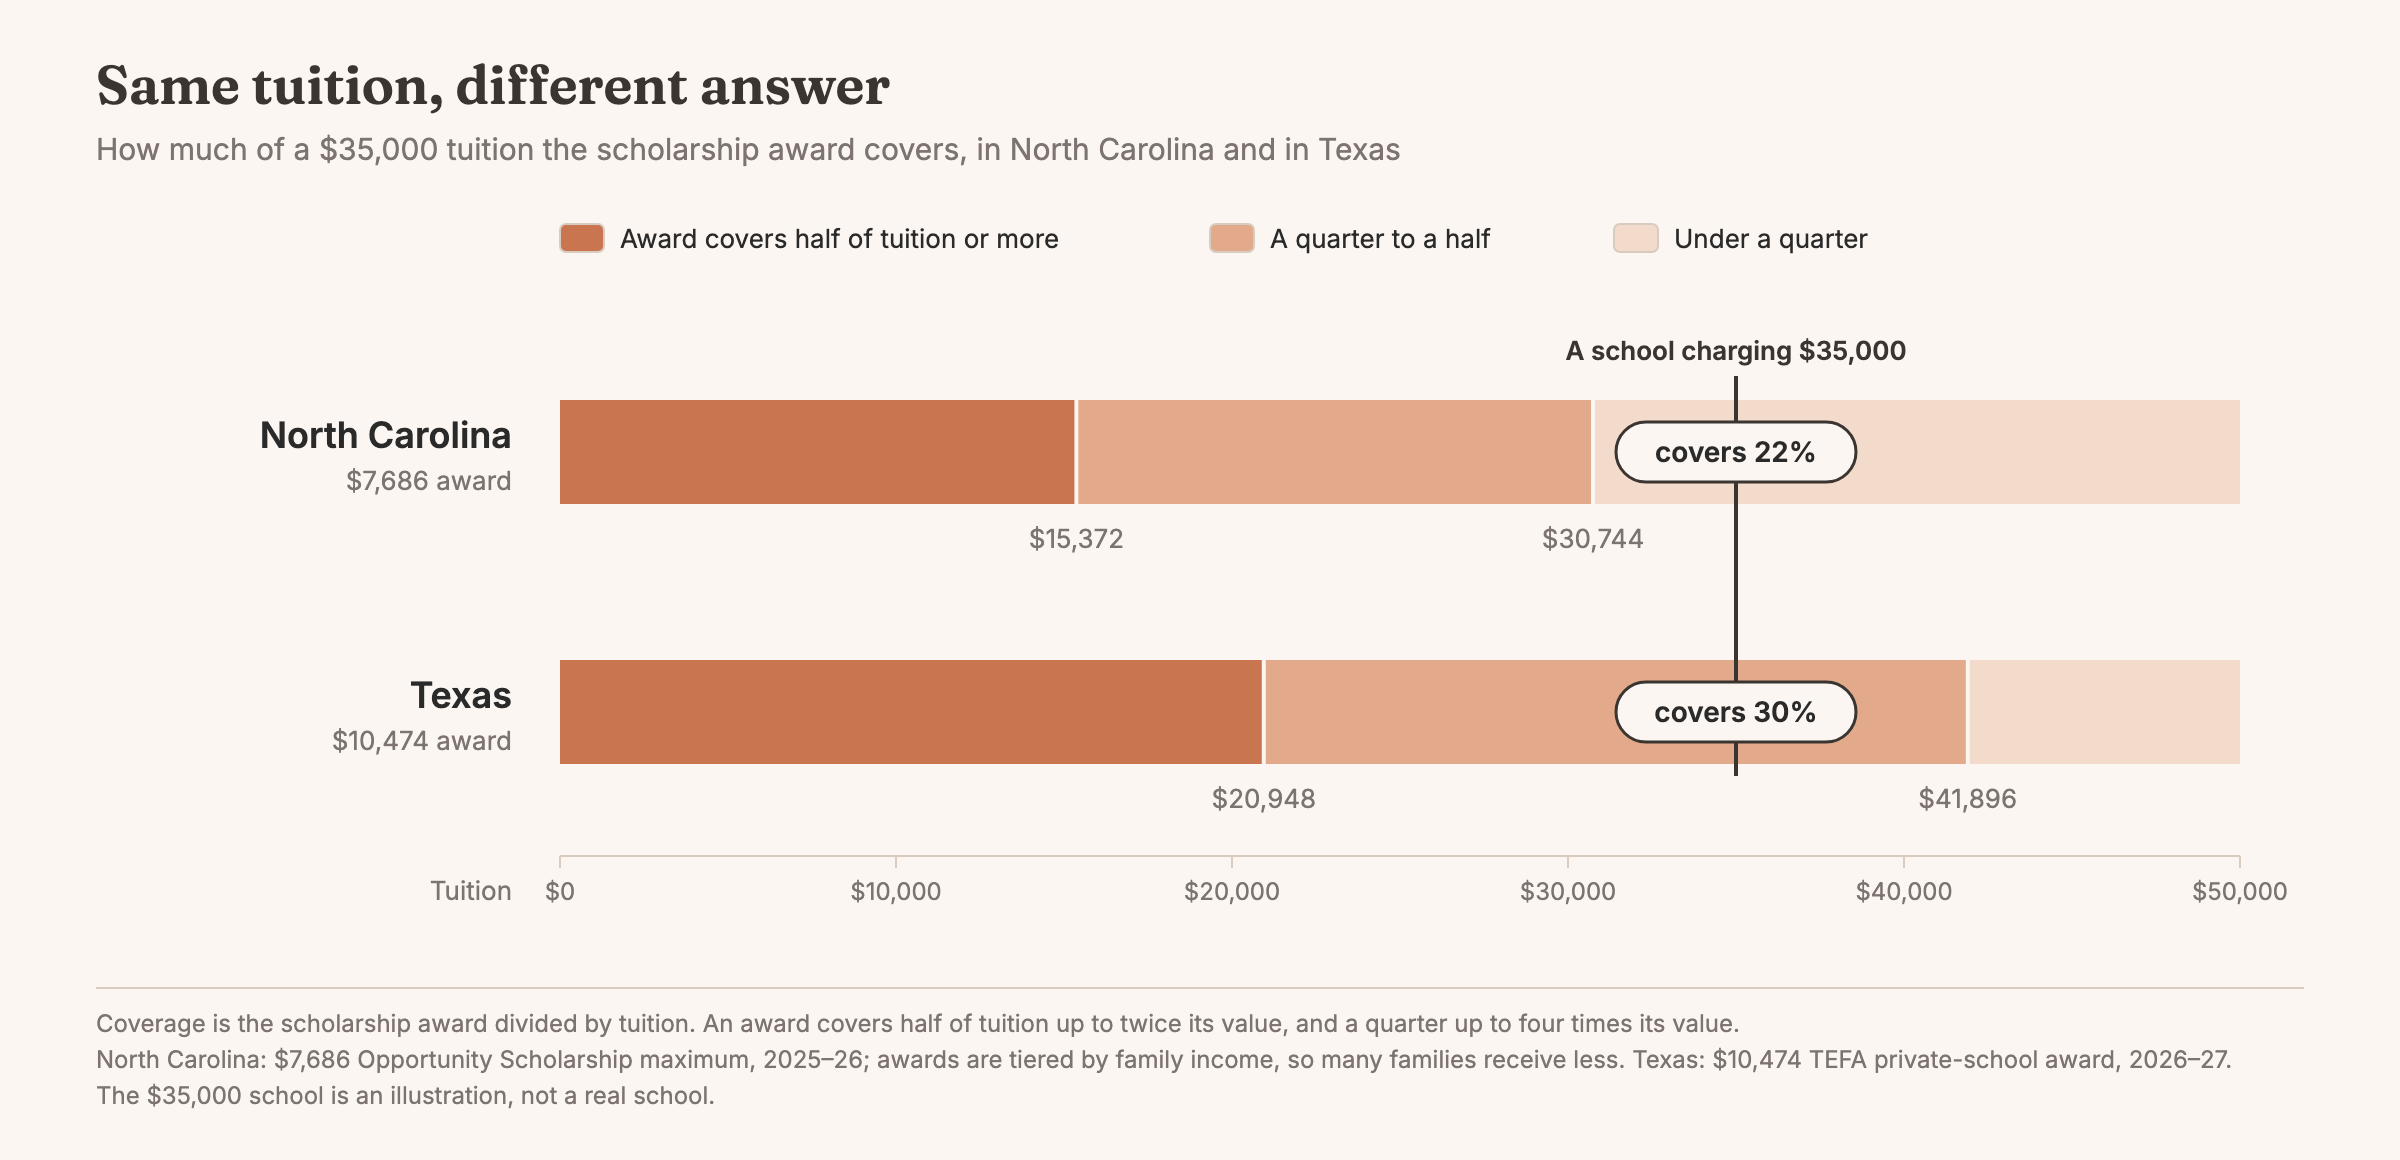
The clearest single pattern is how much of a school's tuition the scholarship covers. Using North Carolina's $7,686 maximum for 2025–26 against each school's published tuition: where the award covers half or more, 21 of 25 schools participate. Between a quarter and a half, 23 of 33. Under a quarter, one of eight. The same $7,686 covers most of the bill at a school charging $12,000 and about a fifth of it at a school charging $38,000, and these schools are distributed sharply across that range.
That describes how the schools are arranged. It does not predict what any one school will do: when I tested it on the large schools in the middle of that range, they split two and two.
The number the participation chart hides
Participation held steady for four years. The money did not.
Among the schools funded in each year, the median ran from about $816 per enrolled student in the first year to about $3,909 in the fourth, and it roughly tripled in the expansion year alone.
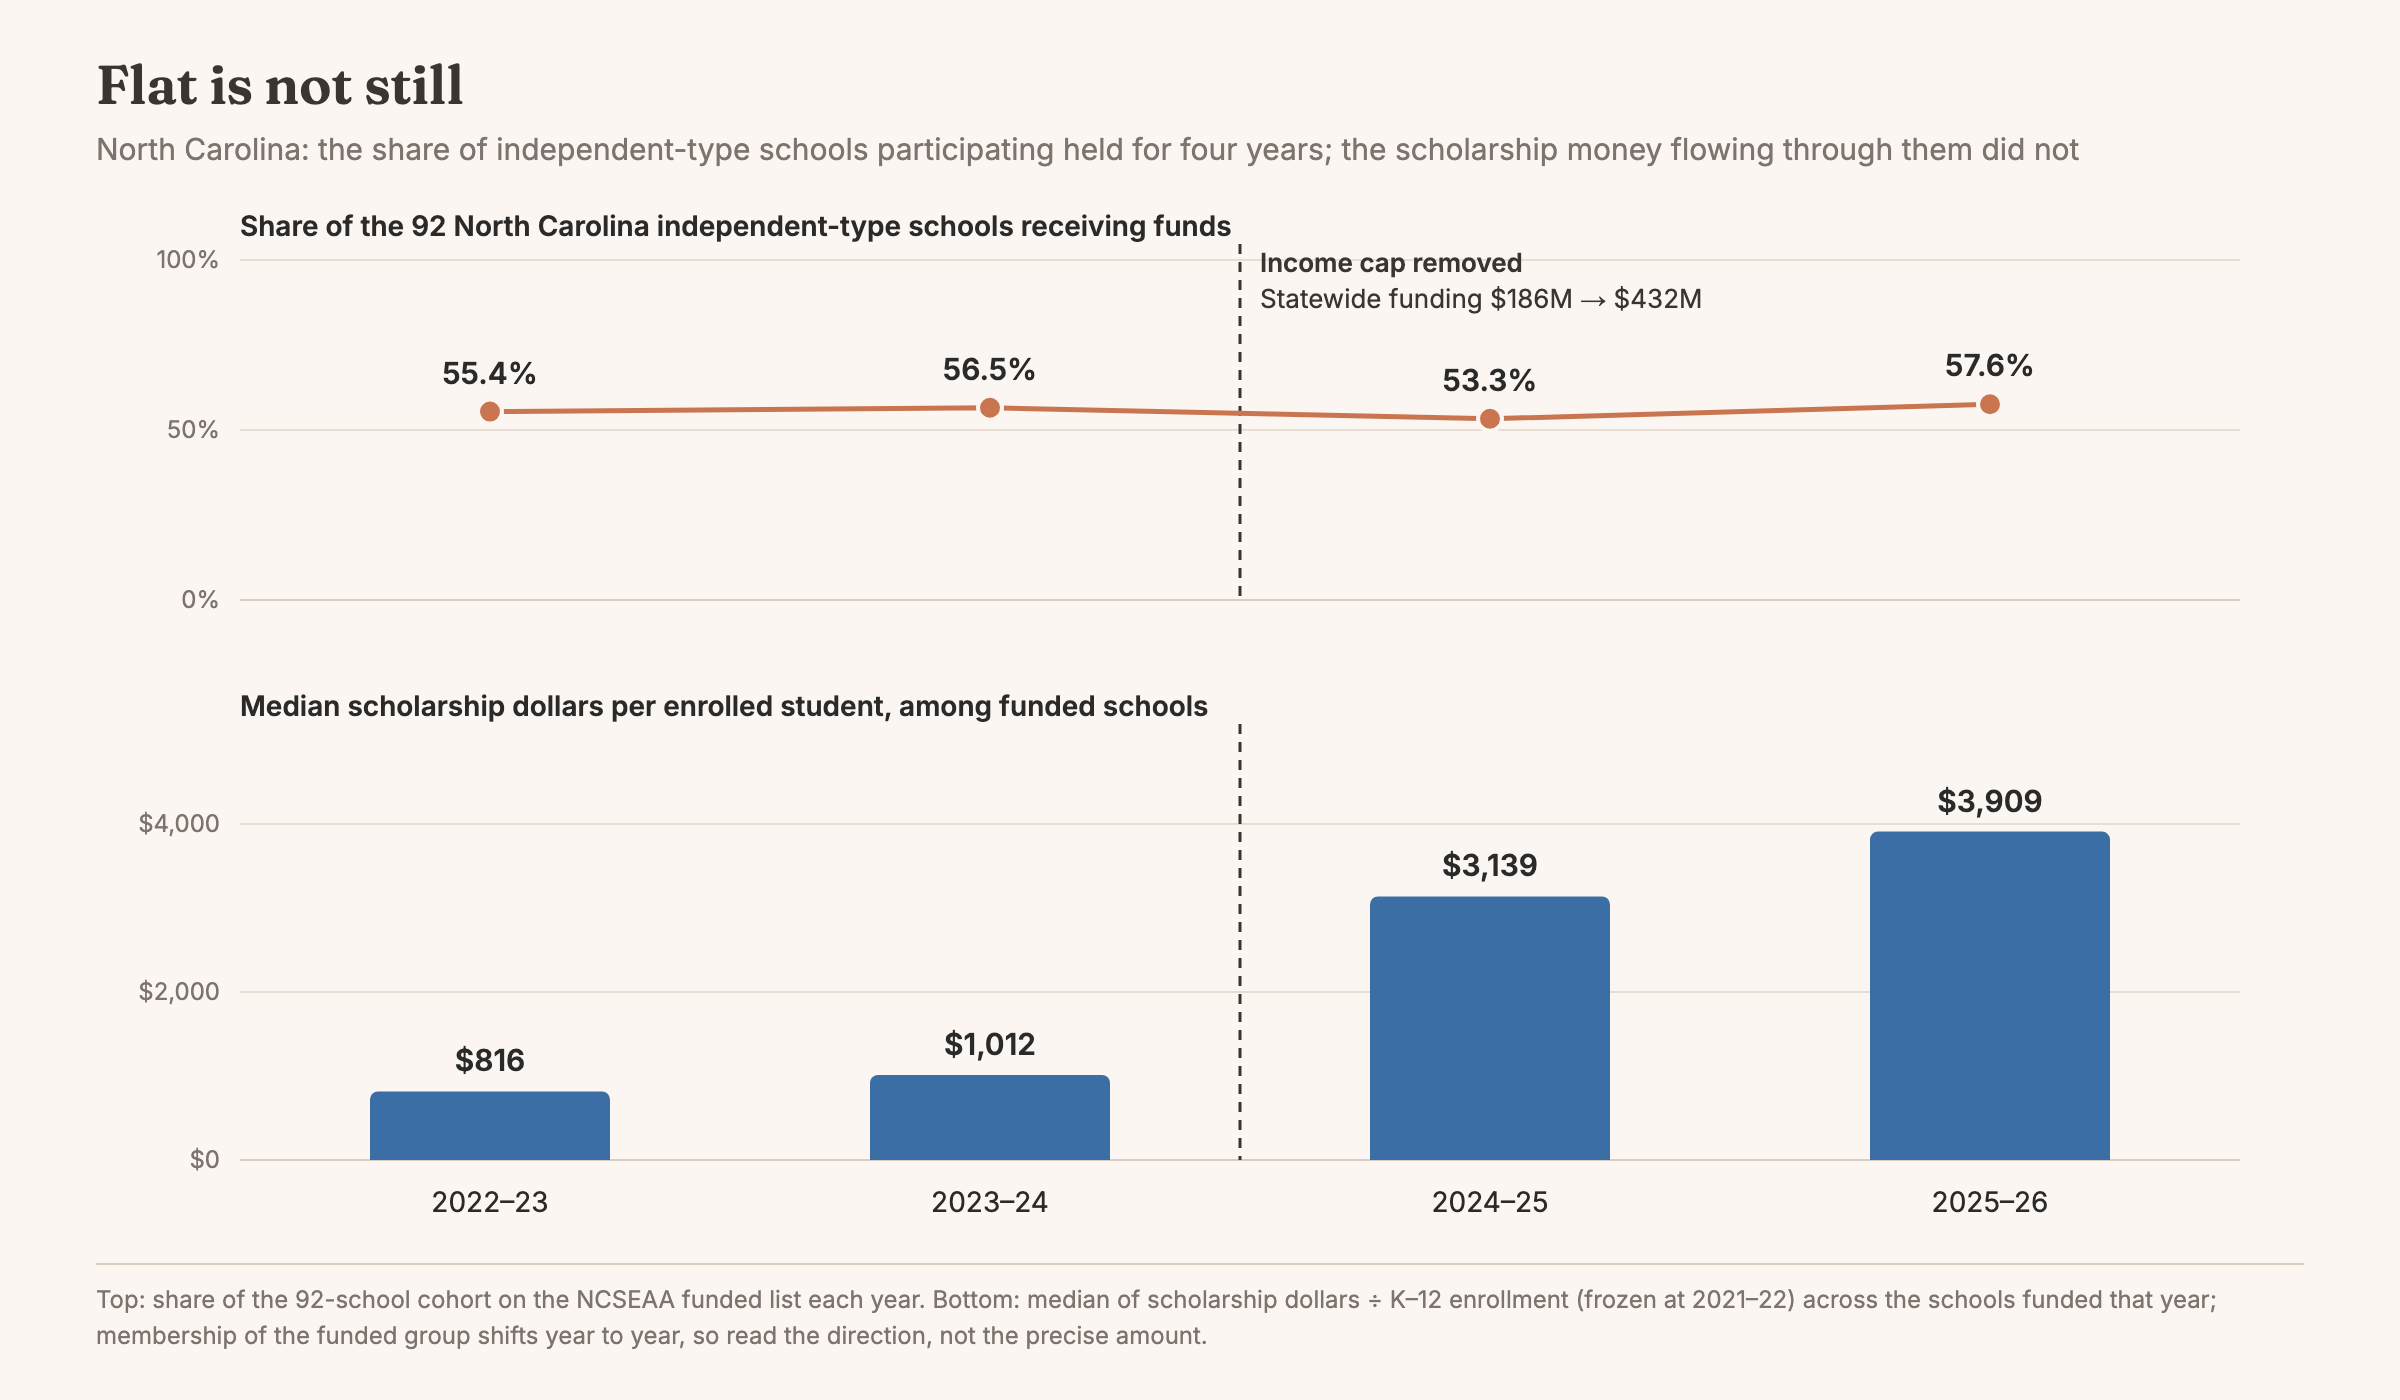
This is the distinction I would want in front of a board. Whether to join is the school's decision. How much money arrives afterward is decided by families, individually, every year.
What would make these numbers wrong
The figures above carry three limits. The award I used is a maximum; awards are tiered by income, so many families received less, and the coverage ratios are approximate rather than any family's arithmetic. Only 66 of the 92 schools publish a usable tuition figure, and those 66 participate at 68% against 58% for the whole group, so the coverage table reads a little more participatory than the full cohort would. And the per-student figure is a median across a group whose membership shifts, using an enrollment count frozen at an earlier year. Treat it as a direction, not a precise amount.
Texas: a bigger check changes the arithmetic
Texas's maximum award is $10,474, roughly a third above North Carolina's.
At $10,474, a school has to charge more than about $42,000 before the award covers less than a quarter of tuition; in North Carolina that line sits near $31,000. Tuition that would put a school at the bottom of the North Carolina range puts it in the middle of the Texas one. Among the twenty-six Texas schools I measured, none falls below the quarter line, and every one of the seven where the award covers half or more participates. The measured set now includes several of the state's largest schools but still misses a few of the best known, which never answered the federal survey, and at least one school outside it does charge above the line, so I would not describe the bottom of the Texas range as empty. What I can say is where the line sits, and that only the very top of the Texas market reaches it.
Side by side, the two states show something one state's data cannot: where a school sits in this arrangement depends on a number legislatures set and revise.
Texas also shows how easily these programs get miscounted. The state approved 2,727 providers for its first year. Of those, 928 are preschools only and another 629 stop at kindergarten, leaving roughly 1,170 serving a first-grader or above. That is nobody's error — a preschool is a legitimate provider — but a provider list is not a school list, and if you are trying to understand what the program means competitively, the relevant count depends on which grades you are asking about. The kindergarten-only providers may still compete for your kindergarten families.
Eight well-known Texas schools declined to participate in the first year. Four of them publicly named a point in 2027, or the 2027–28 school year, when their boards would revisit the question.
What still has to happen
Two kinds of questions remain open.
Some are waiting on decisions that have not been made. The Texas schools that named 2027 will decide in 2027. Whether a deferral was deliberation or a polite no is not knowable until then, and I intend to check.
The rest are waiting on data. How deep the money runs in a participating school can be measured in North Carolina, and in most other states it will take public records requests to find out.
The next question
There is one more piece I have not yet studied.
A new federal scholarship tax credit takes effect in 2027. It works differently from every state program described here: the money reaches schools as private scholarship dollars routed through a charity rather than as a payment from a state, and it is tied to families under an income limit, which means it is likely to interact with a school's financial aid budget rather than behave like ordinary tuition revenue — though how it lands will depend on how a given school accounts for it.
I am not writing that piece yet, because most of the decisions that will shape it have not been made. The regulations are not final. States are still choosing whether to participate. What I will say is that it is already being discussed in board meetings as though it were simply another version of a state voucher, and from everything I can see, it is not.
